· 2 min read

This is a step by step example on how to start using Python with ClickHouse Cloud service.

Note

Keep in mind that Python versions and libraries dependencies are constantly evolving. Make also sure to use the latest supported versions of both the driver and Python environment when trying this.

At the time of writing this article, we're using the clickhouse-connect driver version 0.5.23 and python 3.11.2 respectively.

Steps

  1. Check the Python version:
$  python -V
Python 3.11.2
  1. We'll assemble the project in a folder called ch-python:
$ mkdir ch-python
$ cd ch-python
  1. Create a dependencies file named requirements.txt with:
clickhouse-connect==0.5.23
  1. Create a python source file named main.py:
import clickhouse_connect
import sys
import json

CLICKHOUSE_CLOUD_HOSTNAME = 'HOSTNAME.clickhouse.cloud'
CLICKHOUSE_CLOUD_USER = 'default'
CLICKHOUSE_CLOUD_PASSWORD = 'YOUR_SECRET_PASSWORD'

client = clickhouse_connect.get_client(
host=CLICKHOUSE_CLOUD_HOSTNAME, port=8443, username=CLICKHOUSE_CLOUD_USER, password=CLICKHOUSE_CLOUD_PASSWORD)

print("connected to " + CLICKHOUSE_CLOUD_HOSTNAME + "\n")
client.command(
'CREATE TABLE IF NOT EXISTS new_table (key UInt32, value String, metric Float64) ENGINE MergeTree ORDER BY key')

print("table new_table created or exists already!\n")

row1 = [1000, 'String Value 1000', 5.233]
row2 = [2000, 'String Value 2000', -107.04]
data = [row1, row2]
client.insert('new_table', data, column_names=['key', 'value', 'metric'])

print("written 2 rows to table new_table\n")

QUERY = "SELECT max(key), avg(metric) FROM new_table"

result = client.query(QUERY)

sys.stdout.write("query: ["+QUERY + "] returns:\n\n")
print(result.result_rows)
  1. Create the virtual environment:
chpython$ python -m venv venv
  1. Load the virtual environment:
chpython$ source venv/bin/activate

Once loaded, your terminal prompt should be prefixed with (venv), install dependencies:

(venv) ➜  chpython$ pip install -r requirements.txt
Collecting certifi
Using cached certifi-2023.5.7-py3-none-any.whl (156 kB)
Collecting urllib3>=1.26
Using cached urllib3-2.0.2-py3-none-any.whl (123 kB)
Collecting pytz
Using cached pytz-2023.3-py2.py3-none-any.whl (502 kB)
Collecting zstandard
Using cached zstandard-0.21.0-cp311-cp311-macosx_11_0_arm64.whl (364 kB)
Collecting lz4
Using cached lz4-4.3.2-cp311-cp311-macosx_11_0_arm64.whl (212 kB)
Installing collected packages: pytz, zstandard, urllib3, lz4, certifi, clickhouse-connect
Successfully installed certifi-2023.5.7 clickhouse-connect-0.5.23 lz4-4.3.2 pytz-2023.3 urllib3-2.0.2 zstandard-0.21.0
  1. Launch the code!
(venv) chpython$ venv/bin/python main.py

connected to HOSTNAME.clickhouse.cloud

table new_table created or exists already!

written 2 rows to table new_table

query: [SELECT max(key), avg(metric) FROM new_table] returns:

[(2000, -50.9035)]
Tip

If using an older Python version (e.g. 3.9.6) you might be getting an ImportError related to urllib3 library. In that case either upgrade your Python environment to a newer version or pin the urllib3 version to 1.26.15 in your requirements.txt file.

· 5 min read

How can I use API to manage clusters on ClickHouse Cloud?

Answer

We will use Terraform to configure our infra and ClickHouse Provider

Steps:

1). Create an API Key on Cloud. Follow the docs here - https://clickhouse.com/docs/en/cloud/manage/openapi

Save the creds locally.

2). Install Terraform using - https://developer.hashicorp.com/terraform/tutorials/aws-get-started/install-cli

You can use Homebrew package manager if you're on Mac.

3). Create a directory anywhere you like:

mkdir test
➜ test pwd
/Users/jaijhala/Desktop/terraform/test

4). Create 2 files: main.tf and secret.tfvars

Copy the following:

main.tf file would be:

terraform {
required_providers {
clickhouse = {
source = "ClickHouse/clickhouse"
version = "0.0.2"
}
}
}

variable "organization_id" {
type = string
}

variable "token_key" {
type = string
}

variable "token_secret" {
type = string
}

provider clickhouse {
environment = "production"
organization_id = var.organization_id
token_key = var.token_key
token_secret = var.token_secret
}


variable "service_password" {
type = string
sensitive = true
}

resource "clickhouse_service" "service123" {
name = "jai-terraform"
cloud_provider = "aws"
region = "us-east-2"
tier = "development"
idle_scaling = true
password = var.service_password
ip_access = [
{
source = "0.0.0.0/0"
description = "Anywhere"
}
]
}

output "CLICKHOUSE_HOST" {
value = clickhouse_service.service123.endpoints.0.host
}

You can replace your own parameters like service name, region etc.. in the resources section above.

secret.tfvars is where you'll put all the API Key related info that you downloaded earlier. The idea behind this file is that all your secret credentials will be hidden from the main config file.

It would be something like (replace these parameters):

organization_id = "e957a5f7-4qe3-4b05-ad5a-d02b2dcd0593"
token_key = "QWhhkMeytqQruTeKg"
token_secret = "4b1dNmjWdLUno9lXxmKvSUcPP62jvn7irkuZPbY"
service_password = "password123!"

5). Run terraform init from this directory

Expected output:

Initializing the backend...

Initializing provider plugins...
- Finding clickhouse/clickhouse versions matching "0.0.2"...
- Installing clickhouse/clickhouse v0.0.2...
- Installed clickhouse/clickhouse v0.0.2 (self-signed, key ID D7089EE5C6A92ED1)

Partner and community providers are signed by their developers.
If you'd like to know more about provider signing, you can read about it here:
https://www.terraform.io/docs/cli/plugins/signing.html

Terraform has created a lock file .terraform.lock.hcl to record the provider
selections it made above. Include this file in your version control repository
so that Terraform can guarantee to make the same selections by default when
you run "terraform init" in the future.

Terraform has been successfully initialized!

You may now begin working with Terraform. Try running "terraform plan" to see
any changes that are required for your infrastructure. All Terraform commands
should now work.

If you ever set or change modules or backend configuration for Terraform,
rerun this command to reinitialize your working directory. If you forget, other
commands will detect it and remind you to do so if necessary.

6). Run terraform apply -var-file=secret.tfvars command.

Something like:

➜  test terraform apply -var-file=secret.tfvars

Terraform used the selected providers to generate the following execution plan. Resource actions are indicated with
the following symbols:
+ create

Terraform will perform the following actions:

# clickhouse_service.service123 will be created
+ resource "clickhouse_service" "service123" {
+ cloud_provider = "aws"
+ endpoints = (known after apply)
+ id = (known after apply)
+ idle_scaling = true
+ ip_access = [
+ {
+ description = "Anywhere"
+ source = "0.0.0.0/0"
},
]
+ last_updated = (known after apply)
+ name = "jai-terraform"
+ password = (sensitive value)
+ region = "us-east-2"
+ tier = "development"
}

Plan: 1 to add, 0 to change, 0 to destroy.

Changes to Outputs:
+ CLICKHOUSE_HOST = (known after apply)

Do you want to perform these actions?
Terraform will perform the actions described above.
Only 'yes' will be accepted to approve.

Enter a value: yes

Type yes and hit enter

Side note: Notice it says password = (sensitive value) above. This is because we set sensitive = true for the password in the main.tf file.

7). It will take a couple of mins to create the service but eventually it should come up like:

  Enter a value: yes

clickhouse_service.service123: Creating...
clickhouse_service.service123: Still creating... [10s elapsed]
clickhouse_service.service123: Still creating... [20s elapsed]
clickhouse_service.service123: Still creating... [30s elapsed]
clickhouse_service.service123: Still creating... [40s elapsed]
clickhouse_service.service123: Still creating... [50s elapsed]
clickhouse_service.service123: Still creating... [1m0s elapsed]
clickhouse_service.service123: Still creating... [1m10s elapsed]
clickhouse_service.service123: Still creating... [1m20s elapsed]
clickhouse_service.service123: Still creating... [1m30s elapsed]
clickhouse_service.service123: Still creating... [1m40s elapsed]
clickhouse_service.service123: Creation complete after 1m41s [id=aa8d8d63-1878-4600-8470-630715af38ed]

Apply complete! Resources: 1 added, 0 changed, 0 destroyed.

Outputs:

CLICKHOUSE_HOST = "h3ljlaqez6.us-east-2.aws.clickhouse.cloud"
➜ test

8). Check Cloud Console, you should be able to see the service created.

9). To clean up/destroy the service again, run terraform destroy -var-file=secret.tfvars

Something like:

Terraform used the selected providers to generate the following execution plan. Resource actions are indicated with
the following symbols:
- destroy

Terraform will perform the following actions:

# clickhouse_service.service123 will be destroyed
- resource "clickhouse_service" "service123" {
- cloud_provider = "aws" -> null
- ............

Plan: 0 to add, 0 to change, 1 to destroy.

Changes to Outputs:
- CLICKHOUSE_HOST = "h3ljlaqez6.us-east-2.aws.clickhouse.cloud" -> null

Do you really want to destroy all resources?
Terraform will destroy all your managed infrastructure, as shown above.
There is no undo. Only 'yes' will be accepted to confirm.

Enter a value:

Type yes and hit enter

10).

clickhouse_service.service123: Destroying... [id=aa8d8d63-1878-4600-8470-630715af38ed]
clickhouse_service.service123: Still destroying... [id=aa8d8d63-1878-4600-8470-630715af38ed, 10s elapsed]
clickhouse_service.service123: Still destroying... [id=aa8d8d63-1878-4600-8470-630715af38ed, 20s elapsed]
clickhouse_service.service123: Destruction complete after 27s

Destroy complete! Resources: 1 destroyed.

And it should be gone from the Cloud Console.

More details about the Cloud API can be found here - https://clickhouse.com/docs/en/cloud/manage/api/api-overview

· 2 min read

Requirements

The VPC must be located in one of our ClickPipes regions: us-east-1, us-east-2 or eu-central-1. (https://clickhouse.com/docs/en/integrations/clickpipes#list-of-static-ips)

The recommended approach for integrating RDS with ClickPipes is to utilize PrivateLink along with a Private Hosted Zone on the ClickPipes side. Once configured, all database connections initiated by ClickPipes will traverse through VPC endpoints, as the RDS instance's DNS names will resolve to the PrivateLink endpoint IP addresses. This setup requires the RDS instance to be accessible via unique DNS names. The DNS zone should be unique to avoid conflicts (e.g., myTestDB.123z8u.c2.rds.us-west-1.amazonaws.com).

Follow these steps to create a VPC endpoint service for your RDS instance. Repeat these steps if you have multiple instances that require endpoint services:

  1. Locate Your VPC and Create an NLB
    • Navigate to your target VPC and create a Network Load Balancer (NLB).
  2. Configure the Target Group
    • The target group should point to the RDS instance's endpoint.
    • Ensure that the TCP protocol is used to avoid TLS termination by the NLB.
  3. Set the Listener Port
    • The listener port of the load balancer must match the port used by the target group (typically 5432 for PostgreSQL or 3306 for MySQL).
  4. Ensure the Load Balancer is Private
    • Configure the NLB to be private, ensuring it is only accessible within the VPC.
  5. Create the VPC Endpoint Service
    • In the VPC, create an endpoint service that points to the NLB.
    • Enable acceptance of connection requests from specific accounts.
  6. Authorize ClickPipes to Use the Endpoint Service
    • Grant permission to the ClickPipes account to request this endpoint service.
    • Configure allowed principals by adding the following principal ID: arn:aws:iam::072088201116:root

Initiating connection

When it’s done, share details such as private DNS name, VPC service name and availability zone. ClickPipes team will initiate VPC endpoints creation in ClickPipes VPC. This will require connection request acceptance on your side.

Creating ClickPipes

Use your RDS's private DNS endpoints to create your ClickPipes.

· 2 min read

Question

How do I use the EXCHANGE command to switch table names?

Answer

The EXCHANGE command is useful when you need to switch a current table with another table that is temporary where possibly Primary Keys or other settings were updated. This happens atomically vs with the RENAME command. It is also useful when you have Materialized Views triggering on a source table and are trying to avoid rebuilding the view.

Below is a simple example on how it works and how to test:

  • Create sample database
create database db1;
  • Create example table
create table db1.table1_exchange
(
id Int32,
string_field String
)
engine = MergeTree()
order by id;
  • Insert sample row
insert into db1.table1_exchange
values
(1, 'a');
  • Create example temporary table that will be exchanged
create table db1.table1_exchange_temp
(
id Int32,
string_field String
)
engine = MergeTree()
order by id;
  • Insert sample row into the temporary table
insert into db1.table1_exchange_temp
values
(2, 'b');
  • Run the EXCHANGE command to switch the tables
exchange tables db1.table1_exchange and db1.table1_exchange_temp;
  • Test that the tables are now exchanged and show the rows are switched
clickhouse-cloud :) select * from db1.table1_exchange;

SELECT *
FROM db1.table1_exchange

Query id: 925a9a54-ce0d-406f-9943-16930f770a65

┌─id─┬─string_field─┐
│ 2 │ b │
└────┴──────────────┘

1 row in set. Elapsed: 0.002 sec.

Reference link:
https://clickhouse.com/docs/en/sql-reference/statements/exchange

· 3 min read

Question

How do I output the send_logs_level output to a file using the ClickHouse Client for multiple statements and multiple lines?

Answer

  • Create a SQL file with the statements, for example, send_logs_level_example.sql:
SET send_logs_level = 'trace';
SELECT * FROM db1.table1;
  • Run command to write to the screen and to the file:
cat send_logs_level_example.sql | ./clickhouse client -n -m --host abc123.us-west-2.aws.clickhouse.cloud --secure --port 9440 --password ABC123 --send_logs_level=trace 2>&1 | tee send_log_results.txt
  • Example results:
[c-azure-gk-72-server-tojnalg-0] 2024.08.13 21:31:28.437263 [ 1247 ] {4b347939-db0f-48f8-9550-1ccc7d591c44} <Debug> executeQuery: (from 71.56.215.107:47946) SET send_logs_level = 'trace'; (stage: Complete)
[c-azure-gk-72-server-tojnalg-0] 2024.08.13 21:31:28.437546 [ 1247 ] {4b347939-db0f-48f8-9550-1ccc7d591c44} <Debug> TCPHandler: Processed in 0.000727434 sec.
[c-azure-gk-72-server-tojnalg-0] 2024.08.13 21:31:28.508066 [ 1247 ] {3406aa56-20e8-44e0-b5de-8cb7715861f3} <Debug> executeQuery: (from 71.56.215.107:47946) SELECT * FROM db1.table1; (stage: Complete)
[c-azure-gk-72-server-tojnalg-0] 2024.08.13 21:31:28.508437 [ 1247 ] {3406aa56-20e8-44e0-b5de-8cb7715861f3} <Trace> InterpreterSelectQuery: FetchColumns -> Complete
[c-azure-gk-72-server-tojnalg-0] 2024.08.13 21:31:28.508530 [ 1247 ] {3406aa56-20e8-44e0-b5de-8cb7715861f3} <Debug> db1.table1 (781f25db-3cd1-47c6-a76e-701945a67485) (SelectExecutor): Key condition: unknown
[c-azure-gk-72-server-tojnalg-0] 2024.08.13 21:31:28.508581 [ 1247 ] {3406aa56-20e8-44e0-b5de-8cb7715861f3} <Trace> db1.table1 (781f25db-3cd1-47c6-a76e-701945a67485) (SelectExecutor): Filtering marks by primary and secondary keys
[c-azure-gk-72-server-tojnalg-0] 2024.08.13 21:31:28.508994 [ 1247 ] {3406aa56-20e8-44e0-b5de-8cb7715861f3} <Debug> db1.table1 (781f25db-3cd1-47c6-a76e-701945a67485) (SelectExecutor): Selected 2/2 parts by partition key, 2 parts by primary key, 2/2 marks by primary key, 2 marks to read from 2 ranges
[c-azure-gk-72-server-tojnalg-0] 2024.08.13 21:31:28.509034 [ 1247 ] {3406aa56-20e8-44e0-b5de-8cb7715861f3} <Trace> db1.table1 (781f25db-3cd1-47c6-a76e-701945a67485) (SelectExecutor): Spreading mark ranges among streams (default reading)
[c-azure-gk-72-server-tojnalg-0] 2024.08.13 21:31:28.509102 [ 1247 ] {3406aa56-20e8-44e0-b5de-8cb7715861f3} <Debug> MergeTreePrefetchedReadPool(db1.table1 (781f25db-3cd1-47c6-a76e-701945a67485)): Increasing prefetch step from 0 to 24
[c-azure-gk-72-server-tojnalg-0] 2024.08.13 21:31:28.509146 [ 1247 ] {3406aa56-20e8-44e0-b5de-8cb7715861f3} <Debug> MergeTreePrefetchedReadPool(db1.table1 (781f25db-3cd1-47c6-a76e-701945a67485)): Part: all_0_3_2, sum_marks: 1, approx mark size: 0, prefetch_step_bytes: 0, prefetch_step_marks: 24, (ranges: (0, 1))
[c-azure-gk-72-server-tojnalg-0] 2024.08.13 21:31:28.509180 [ 1247 ] {3406aa56-20e8-44e0-b5de-8cb7715861f3} <Debug> MergeTreePrefetchedReadPool(db1.table1 (781f25db-3cd1-47c6-a76e-701945a67485)): Increasing prefetch step from 0 to 24
[c-azure-gk-72-server-tojnalg-0] 2024.08.13 21:31:28.509218 [ 1247 ] {3406aa56-20e8-44e0-b5de-8cb7715861f3} <Debug> MergeTreePrefetchedReadPool(db1.table1 (781f25db-3cd1-47c6-a76e-701945a67485)): Part: all_4_4_0, sum_marks: 1, approx mark size: 0, prefetch_step_bytes: 0, prefetch_step_marks: 24, (ranges: (0, 1))
[c-azure-gk-72-server-tojnalg-0] 2024.08.13 21:31:28.509251 [ 1247 ] {3406aa56-20e8-44e0-b5de-8cb7715861f3} <Debug> MergeTreePrefetchedReadPool(db1.table1 (781f25db-3cd1-47c6-a76e-701945a67485)): Sum marks: 2, threads: 2, min_marks_per_thread: 1, min prefetch step marks: 24, prefetches limit: 200, total_size_approx: 0
[c-azure-gk-72-server-tojnalg-0] 2024.08.13 21:31:28.509312 [ 1247 ] {3406aa56-20e8-44e0-b5de-8cb7715861f3} <Debug> db1.table1 (781f25db-3cd1-47c6-a76e-701945a67485) (SelectExecutor): Reading approx. 8 rows with 2 streams
1 a
2 b
3 test, test
4 test, "test"
1 a
2 b
3 a
4 b
[c-azure-gk-72-server-tojnalg-0] 2024.08.13 21:31:28.510601 [ 1247 ] {3406aa56-20e8-44e0-b5de-8cb7715861f3} <Debug> executeQuery: Read 8 rows, 152.00 B in 0.002588 sec., 3091.190108191654 rows/sec., 57.36 KiB/sec.
[c-azure-gk-72-server-tojnalg-0] 2024.08.13 21:31:28.510663 [ 1247 ] {3406aa56-20e8-44e0-b5de-8cb7715861f3} <Debug> TCPHandler: Processed in 0.002984367 sec.

Reference link: https://clickhouse.com/docs/en/operations/settings/settings#send_logs_level

· 3 min read

Types of profilers

LLVM already includes a tool that instruments the code that allows us to do instrumentation profiling. As opposed to sampling or statistical profiling, it's very precise without losing any calls, at the expense of needing to instrument the code and be more resource expensive.

In a few words, an instrumentation profiler introduces new code to track the call to all functions. Statistical profilers allow us to run the code without requiring any changes, taking snapshots periodically to see the state of the application. So, only the functions running while the snapshot is taken are considered. perf is a very well-known statistical profiler.

How to profile with XRay

Instrument the code

Imagine the following souce code:

#include <chrono>
#include <cstdio>
#include <thread>

void one()
{
std::this_thread::sleep_for(std::chrono::milliseconds(10));
}

void two()
{
std::this_thread::sleep_for(std::chrono::milliseconds(5));
}

int main()
{
printf("Start\n");

for (int i = 0; i < 10; ++i)
{
one();
two();
}

printf("Finish\n");
}

In order to instrument with XRay, we need to add some flags like so:

clang++ -o test test.cpp -fxray-instrument -fxray-instruction-threshold=1
  • -fxray-instrument is needed to instrument the code.
  • -fxray-instruction-threshold=1 is used so that it instruments all functions, even if they're very small as in our example. By default, it instruments functions with at least 200 instructions.

We can ensure the code has been instrumented correctly by checking there's a new section in the binary:

objdump -h -j xray_instr_map test

test: file format elf64-x86-64

Sections:
Idx Name Size VMA LMA File off Algn
17 xray_instr_map 000005c0 000000000002f91c 000000000002f91c 0002f91c 2**0
CONTENTS, ALLOC, LOAD, READONLY, DATA

Run the process with proper env var values to collect the trace

By default, there is no profiler collection unless explicitly asked for. In other words, unless we're profiling the overhead is negligible. We can set different values for XRAY_OPTIONS to configure when the profiler starts collecting and how it does so.

XRAY_OPTIONS="patch_premain=true xray_mode=xray-basic verbosity=1" ./test
==74394==XRay: Log file in 'xray-log.test.14imlN'
Start
Finish
==74394==Cleaned up log for TID: 74394

Convert the trace

XRAy's traces can be converted to several formats. The trace_event format is very useful because it's easy to parse and there are already a number of tools that support it, so we'll use that one:

llvm-xray convert --symbolize --instr_map=./test --output-format=trace_event xray-log.test.14imlN | gzip > test-trace.txt.gz

Visualize the trace

We can use web-based UIs like speedscope.app or Perfetto.

While Perfetto makes visualizing multiple threads and querying the data easier, speedscope is better generating a flamegraph and a sandwich view of your data.

Time Order

time-order

Left Heavy

left-heavy

Sandwitch

sandwich

Profiling ClickHouse

  1. Pass -DENABLE_XRAY=1 to cmake when building ClickHouse. This sets the proper compiler flags.
  2. Set XRAY_OPTIONS="patch_premain=true xray_mode=xray-basic verbosity=1 env var when running ClickHouse to generate the trace.
  3. Convert the trace to an interesting format such as trace event: llvm-xray convert --symbolize --instr_map=./build/programs/clickhouse --output-format=trace_event xray-log.clickhouse.ZqKprE | gzip > clickhouse-trace.txt.gz.
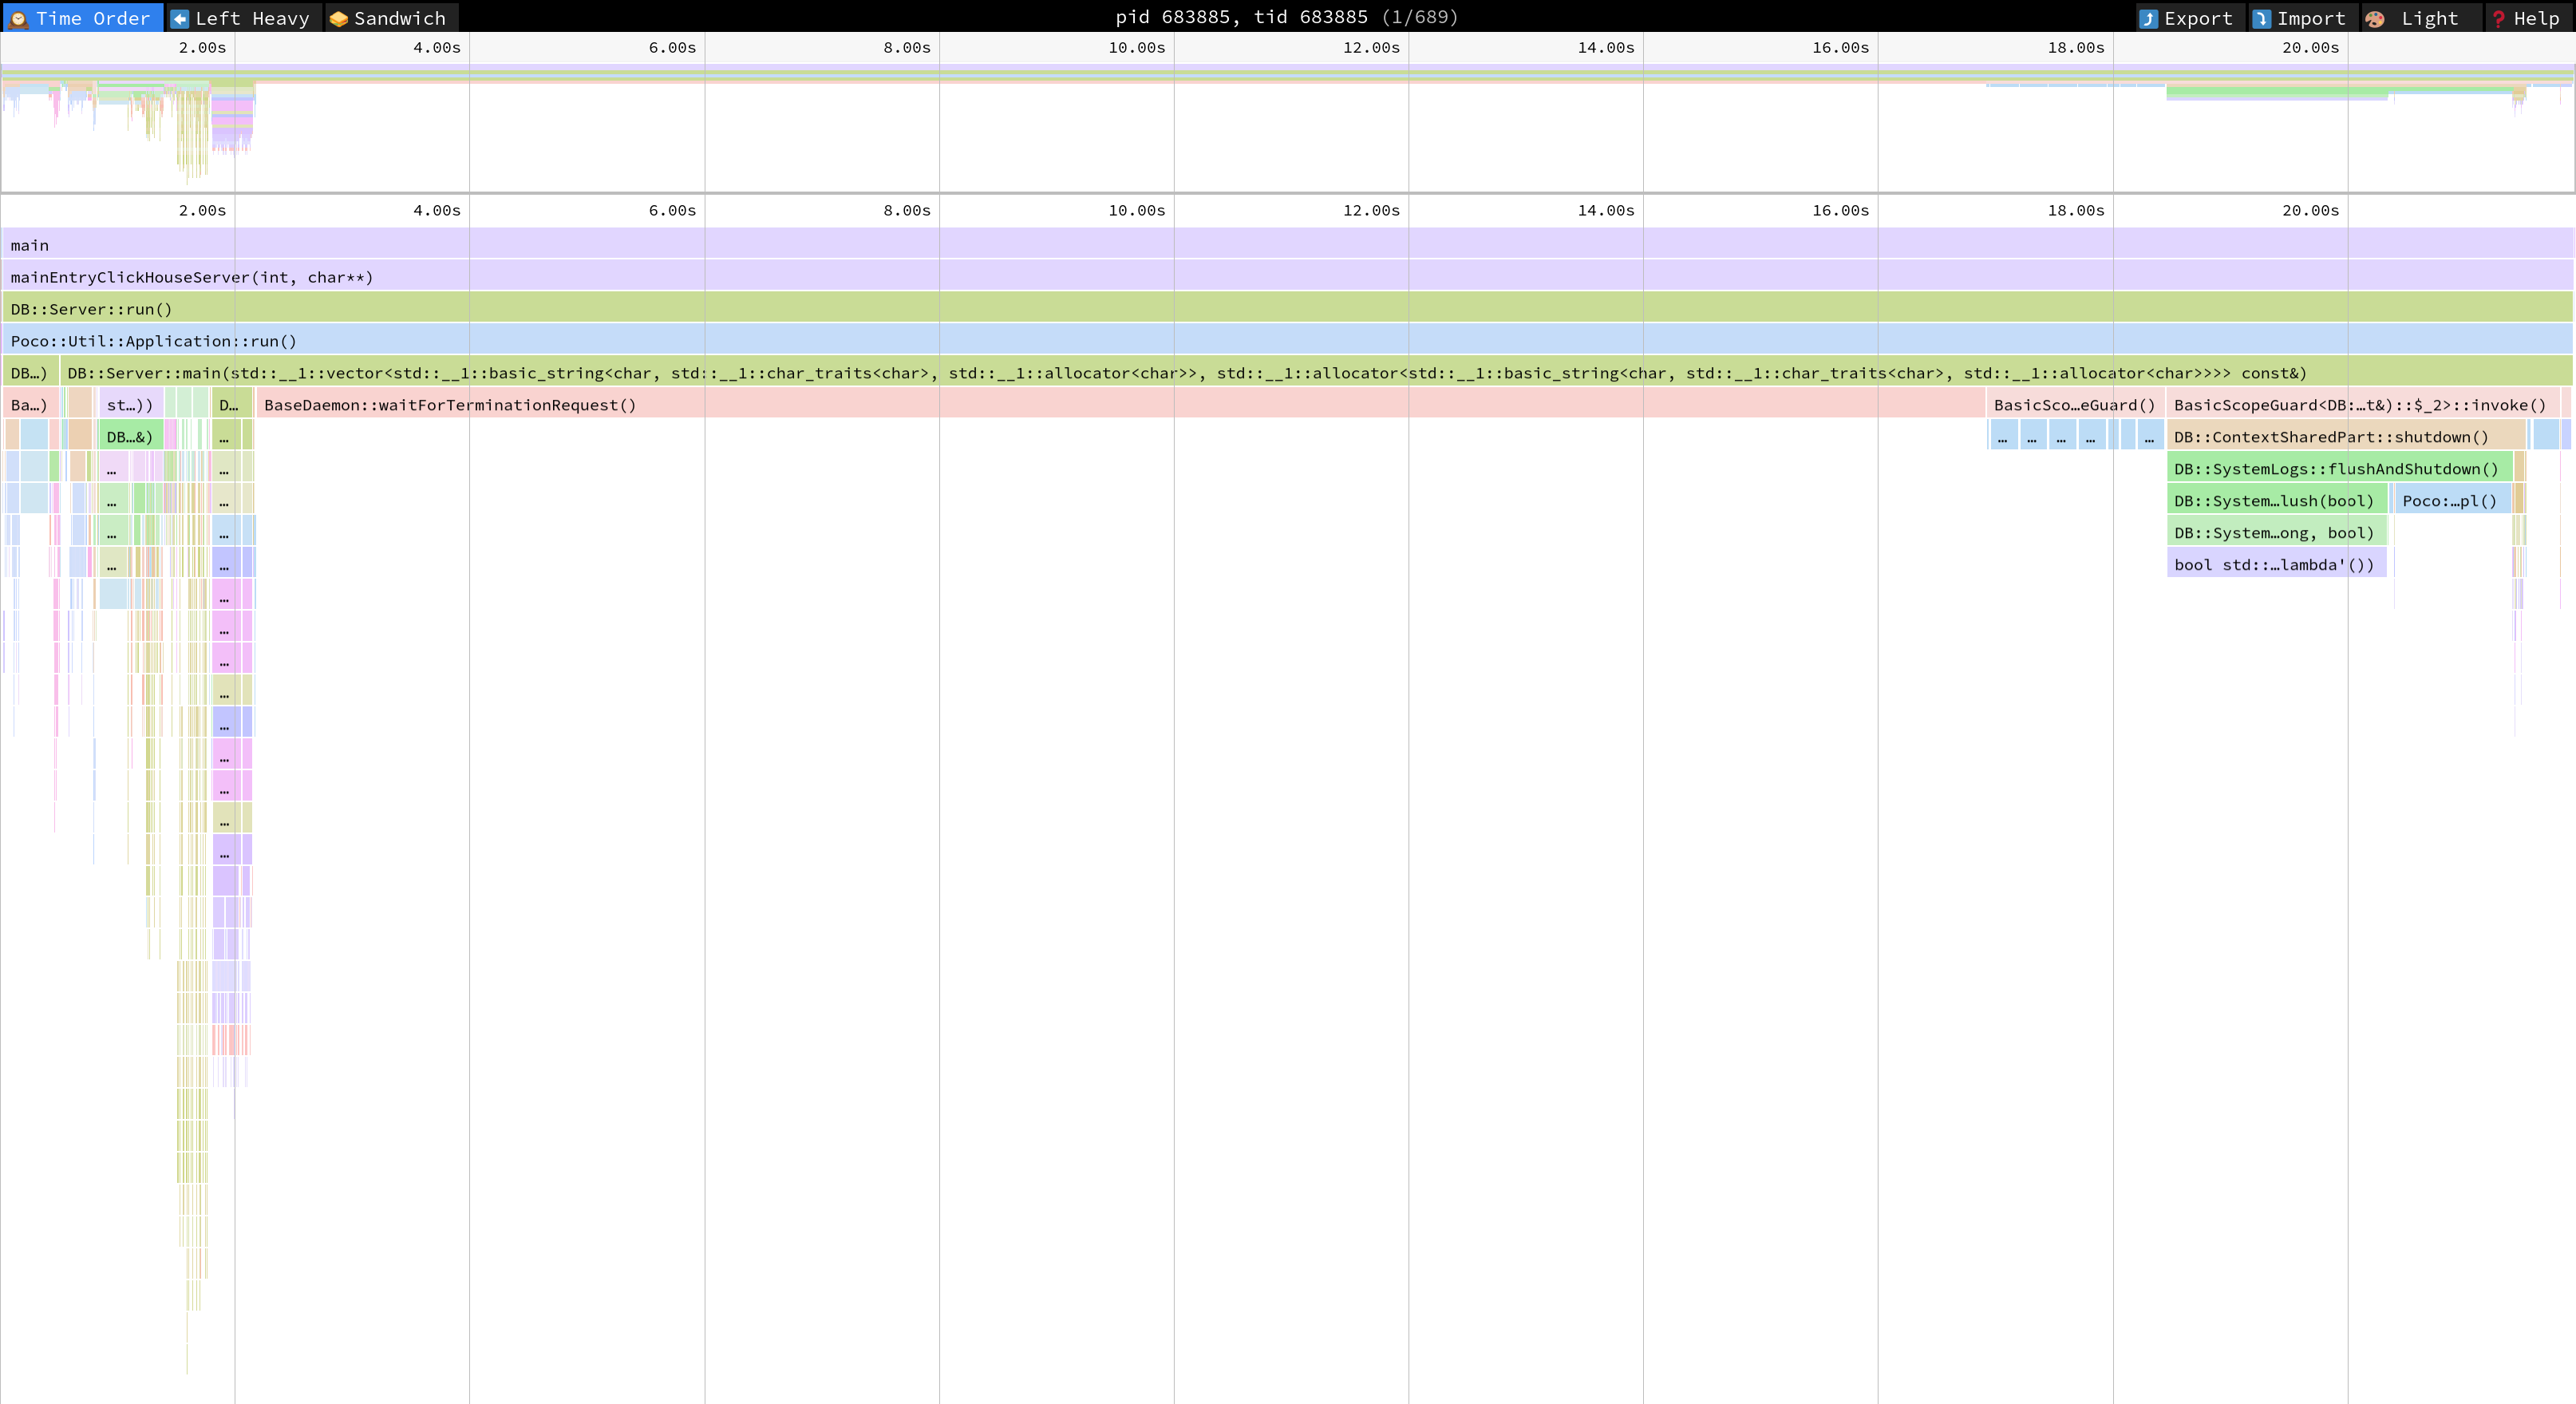
  4. Visualize the trace in speedscope.app or Perfetto.

clickhouse-time-order

Notice that this is the visualization of only one thread. You can select the others tids on the top bar.

Check out the docs

Take a look at the XRay Instrumentation and Debugging with XRay documentation to learn more details.

· 4 min read

With the introduction of the new JSON data type, ClickHouse is now a good choice of database for doing JSON analytics. In this guide, we're going to learn how to load JSON messages from Apache Kafka directly into a single JSON column in ClickHouse.

Setup Kafka

Let's start by running a Kafka broker on our machine. We're also going to map port 9092 to port 9092 on our host operating system so that it's easier to interact with Kafka:

docker run --name broker -p 9092:9092 apache/kafka:3.8.1

Ingest data into Kafka

Once that's running, we need to ingest some data. The Wikimedia recent changes feed is a good source of streaming data, so let's ingest that into the wiki_events topic:

curl -N https://stream.wikimedia.org/v2/stream/recentchange 2>/dev/null |
awk '/^data: /{gsub(/^data: /, ""); print}' |
jq -cr --arg sep ø '[.meta.id, tostring] | join($sep)' |
kcat -P -b localhost:9092 -t wiki_events -Kø

We can check tha the data's being ingested by running the following command:

kcat -C -b localhost:9092  -t wiki_events
{"$schema":"/mediawiki/recentchange/1.0.0","meta":{"uri":"https://www.wikidata.org/wiki/Q130972321","request_id":"5c687ded-4721-4bfc-ae6c-58ca25f4a6ce","id":"0fbb0982-c43b-4e8b-989b-db7e78dbdc76","dt":"2024-11-06T11:59:57Z","domain":"www.wikidata.org","stream":"mediawiki.recentchange","topic":"codfw.mediawiki.recentchange","partition":0,"offset":1228777205},"id":2338656448,"type":"edit","namespace":0,"title":"Q130972321","title_url":"https://www.wikidata.org/wiki/Q130972321","comment":"/* wbsetclaim-create:2||1 */ [[Property:P18]]: Mahdi Rrezaei Journalist.jpg","timestamp":1730894397,"user":"Wikimellatir","bot":false,"notify_url":"https://www.wikidata.org/w/index.php?diff=2270885254&oldid=2270870214&rcid=2338656448","minor":false,"patrolled":false,"length":{"old":4269,"new":4636},"revision":{"old":2270870214,"new":2270885254},"server_url":"https://www.wikidata.org","server_name":"www.wikidata.org","server_script_path":"/w","wiki":"wikidatawiki","parsedcomment":"<span dir=\"auto\"><span class=\"autocomment\">Created claim: </span></span> <a href=\"/wiki/Property:P18\" title=\"image | image of relevant illustration of the subject; if available, also use more specific properties (sample: coat of arms image, locator map, flag image, signature image, logo image, collage image)\"><span class=\"wb-itemlink\"><span class=\"wb-itemlink-label\" lang=\"en\" dir=\"ltr\">image</span> <span class=\"wb-itemlink-id\">(P18)</span></span></a>: Mahdi Rrezaei Journalist.jpg"}
{"$schema":"/mediawiki/recentchange/1.0.0","meta":{"uri":"https://www.wikidata.org/wiki/Q75756596","request_id":"eb116219-7372-4725-986f-790211708d36","id":"9e0d5299-5bd1-4c58-b796-9852afd8a84e","dt":"2024-11-06T11:59:54Z","domain":"www.wikidata.org","stream":"mediawiki.recentchange","topic":"codfw.mediawiki.recentchange","partition":0,"offset":1228777206},"id":2338656449,"type":"edit","namespace":0,"title":"Q75756596","title_url":"https://www.wikidata.org/wiki/Q75756596","comment":"/* wbeditentity-update-languages-and-other:0||55 */ mv labels and aliases matching [[Property:P528]] or [[Property:P3083]] to mul","timestamp":1730894394,"user":"Twofivesixbot","bot":true,"notify_url":"https://www.wikidata.org/w/index.php?diff=2270885237&oldid=2147709089&rcid=2338656449","minor":false,"patrolled":true,"length":{"old":30879,"new":27161},"revision":{"old":2147709089,"new":2270885237},"server_url":"https://www.wikidata.org","server_name":"www.wikidata.org","server_script_path":"/w","wiki":"wikidatawiki","parsedcomment":"<span dir=\"auto\"><span class=\"autocomment\">Changed label, description and/or aliases in 55 languages, and other parts: </span></span> mv labels and aliases matching <a href=\"/wiki/Property:P528\" title=\"catalog code | catalog name of an object, use with qualifier P972\"><span class=\"wb-itemlink\"><span class=\"wb-itemlink-label\" lang=\"en\" dir=\"ltr\">catalog code</span> <span class=\"wb-itemlink-id\">(P528)</span></span></a> or <a href=\"/wiki/Property:P3083\" title=\"SIMBAD ID | identifier for an astronomical object, in the University of Strasbourg&#039;s SIMBAD database\"><span class=\"wb-itemlink\"><span class=\"wb-itemlink-label\" lang=\"en\" dir=\"ltr\">SIMBAD ID</span> <span class=\"wb-itemlink-id\">(P3083)</span></span></a> to mul"}

So far, so good.

Ingest data into ClickHouse

Next, we're going to ingest the data into ClickHouse. First, let's enable the JSON type (which is currently experimental), by setting the following property:

SET allow_experimental_json_type = 1;

Now, we'll create the wiki_queue table, which uses the Kafka table engine.

CREATE TABLE wiki_queue
(
json JSON
)
ENGINE = Kafka(
'localhost:9092',
'wiki_events',
'clickhouse-consumer-group',
'JSONAsObject'
);

Note that we're using the JSONAsObject format, which will ensure that incoming messages are made available as a JSON object. This format can only be parsed into a table that has a single column with the JSON type.

Next, we'll create the underlying table to store the Wiki data:

CREATE TABLE wiki
(
json JSON,
id String MATERIALIZED getSubcolumn(json, 'meta.id')
)
ENGINE = MergeTree
ORDER BY id;

Finally, let's create a materialized view to populate the wiki table:

CREATE MATERIALIZED VIEW wiki_mv TO wiki AS 
SELECT json
FROM wiki_queue;

Querying JSON data in ClickHouse

We can then write queries against the wiki table. For example, we could count the number of bots that have committed changes:

SELECT json.bot, count()
FROM wiki
GROUP BY ALL
   ┌─json.bot─┬─count()─┐
1. │ true │ 2526 │
2. │ false │ 4691 │
└──────────┴─────────┘

Or we could find out the users that make the most changes on en.wikipedia.org:

SELECT
json.user,
count()
FROM wiki
WHERE json.server_name = 'en.wikipedia.org'
GROUP BY ALL
ORDER BY count() DESC
LIMIT 10
    ┌─json.user──────────────────────────────┬─count()─┐
1. │ Monkbot │ 267 │
2. │ Onel5969 │ 107 │
3. │ Bangwiki │ 37 │
4. │ HHH Pedrigree │ 28 │
5. │ REDACTED403 │ 23 │
6. │ KylieTastic │ 22 │
7. │ Tinniesbison │ 21 │
8. │ XTheBedrockX │ 20 │
9. │ 2001:4455:1DB:4000:51F3:6A16:408E:69FC │ 19 │
10. │ Wcquidditch │ 15 │
└────────────────────────────────────────┴─────────┘

· 2 min read

Question

How can I connect to CH Cloud service using SSH Key Authentication?

Answer

1) Use ssh-keygen to create the keypair. Example:

➜  new ssh-keygen \
-t ed25519 \
> -f /Users/testuser/.ssh/ch_key
Generating public/private ed25519 key pair.
Enter passphrase (empty for no passphrase):
Enter same passphrase again:
Your identification has been saved in /Users/testuser/.ssh/ch_key
Your public key has been saved in /Users/testuser/.ssh/ch_key.pub
.....

2) Use the public key (ch_key.pub in above example) to create the USER.

clickhouse-cloud :) CREATE USER abcuser IDENTIFIED WITH ssh_key BY KEY 'AAAABBBcdE1lZDI1NTE5AAAAIISdl4CrGM8mckXBUXLjL3ef9XwnycDWEvBPu3toB40m' TYPE 'ssh-ed25519';

CREATE USER abcuser IDENTIFIED WITH ssh_key BY KEY AAAABBBcdE1lZDI1NTE5AAAAIISdl4CrGM8mckXBUXLjL3ef9XwnycDWEvBPu3toB40m TYPE `ssh-ed25519`

Query id: 34c6aad6-5f88-4c80-af7a-7d37c91ba7d5

Ok.

3) Run SHOW users to confirm the user creation.

4) Grant default_role to the user (optional).

clickhouse-cloud :) grant default_role to abcuser;

GRANT default_role TO abcuser

Query id: 4a054003-220a-4dea-8e8d-eb1f08ee7b10

Ok.

0 rows in set. Elapsed: 0.137 sec.

5) Use the private key now to authenticate against the service.

➜  new ./clickhouse client --host myhost.us-central1.gcp.clickhouse.cloud --secure --user abcuser --ssh-key-file '/Users/testuser/.ssh/ch_key'
ClickHouse client version 23.12.1.863 (official build).
Enter your private key passphrase (leave empty for no passphrase):
Connecting to myhost.us-central1.gcp.clickhouse.cloud:9440 as user abcuser.
Connected to ClickHouse server version 23.9.2.

clickhouse-cloud :) select currentUser();

SELECT currentUser()

Query id: d4b6bb60-ef45-47d3-8740-db9f2941dcd2

┌─currentUser()─┐
│ abcuser │
└───────────────┘

1 row in set. Elapsed: 0.001 sec.

clickhouse-cloud :)

· 3 min read

The table below provides the mapping for the metrics used in system.dashboards to Prometheus metrics in system.custom_metrics.
This is useful for customers who want to monitor for the same metrics found in system.dashboards.

Mapping table for metrics in system.dashboards to Prometheus metrics in system.custom_metrics

DashboardTitlePrometheus Metric Name (system.custom_metrics)
OverviewQueries/secondClickHouseProfileEvents_Query
OverviewCPU Usage (cores)ClickHouseProfileEvents_OSCPUVirtualTimeMicroseconds
OverviewQueries RunningClickHouseMetrics_Query
OverviewMerges RunningClickHouseMetrics_Merge
OverviewSelected Bytes/secondClickHouseProfileEvents_SelectedBytes
OverviewIO WaitClickHouseProfileEvents_OSIOWaitMicroseconds
OverviewCPU WaitClickHouseProfileEvents_OSCPUWaitMicroseconds
OverviewOS CPU Usage (Userspace)ClickHouseAsyncMetrics_OSUserTimeNormalized
OverviewOS CPU Usage (Kernel)ClickHouseAsyncMetrics_OSSystemTimeNormalized
OverviewRead From DiskClickHouseProfileEvents_OSReadBytes
OverviewRead From FilesystemClickHouseProfileEvents_OSReadChars
OverviewMemory (tracked)ClickHouseMetrics_MemoryTracking
OverviewLoad Average (15 minutes)ClickHouseAsyncMetrics_LoadAverage15
OverviewSelected Rows/secondClickHouseProfileEvents_SelectedRows
OverviewInserted Rows/secondClickHouseProfileEvents_InsertedRows
OverviewTotal MergeTree PartsClickHouseAsyncMetrics_TotalPartsOfMergeTreeTables
OverviewMax Parts For PartitionClickHouseAsyncMetrics_MaxPartCountForPartition
Cloud overviewQueries/secondClickHouseProfileEvents_Query
Cloud overviewCPU Usage (cores)ClickHouseProfileEvents_OSCPUVirtualTimeMicroseconds
Cloud overviewQueries RunningClickHouseMetrics_Query
Cloud overviewMerges RunningClickHouseMetrics_Merge
Cloud overviewSelected Bytes/secondClickHouseProfileEvents_SelectedBytes
Cloud overviewIO Wait (local fs)ClickHouseProfileEvents_OSIOWaitMicroseconds
Cloud overviewS3 read waitClickHouseProfileEvents_ReadBufferFromS3Microseconds
Cloud overviewS3 read errors/secProfileEvent_ReadBufferFromS3RequestsErrors
Cloud overviewCPU WaitClickHouseProfileEvents_OSCPUWaitMicroseconds
Cloud overviewOS CPU Usage (Userspace, normalized)ClickHouseAsyncMetrics_OSUserTimeNormalized
Cloud overviewOS CPU Usage (Kernel, normalized)ClickHouseAsyncMetrics_OSSystemTimeNormalized
Cloud overviewRead From Disk (bytes/sec)ClickHouseProfileEvents_OSReadBytes
Cloud overviewRead From Filesystem (bytes/sec)ClickHouseProfileEvents_OSReadChars
Cloud overviewMemory (tracked, bytes)ClickHouseMetrics_MemoryTracking
Cloud overviewLoad Average (15 minutes)ClickHouseAsyncMetrics_LoadAverage15
Cloud overviewSelected Rows/secClickHouseProfileEvents_SelectedRows
Cloud overviewInserted Rows/secClickHouseProfileEvents_InsertedRows
Cloud overviewTotal MergeTree PartsClickHouseAsyncMetrics_TotalPartsOfMergeTreeTables
Cloud overviewMax Parts For PartitionClickHouseAsyncMetrics_MaxPartCountForPartition
Cloud overviewRead From S3 (bytes/sec)ClickHouseProfileEvents_ReadBufferFromS3Bytes
Cloud overviewFilesystem Cache SizeClickHouseMetrics_FilesystemCacheSize
Cloud overviewDisk S3 write req/secClickHouseProfileEvents_DiskS3PutObject + ClickHouseProfileEvents_DiskS3UploadPart + ClickHouseProfileEvents_DiskS3CreateMultipartUpload + ClickHouseProfileEvents_DiskS3CompleteMultipartUpload
Cloud overviewDisk S3 read req/secClickHouseProfileEvents_DiskS3GetObject + ClickHouseProfileEvents_DiskS3HeadObject + ClickHouseProfileEvents_DiskS3ListObjects
Cloud overviewFS cache hit rateClickHouseProfileEvents_CachedReadBufferReadFromCacheBytes / (ClickHouseProfileEvents_CachedReadBufferReadFromCacheBytes + ClickHouseProfileEvents_CachedReadBufferReadFromSourceBytes)
Cloud overviewPage cache hit rategreatest(0, (sum(ClickHouseProfileEvents_OSReadChars) - sum(ClickHouseProfileEvents_OSReadBytes)) / (sum(ClickHouseProfileEvents_OSReadChars) + sum(ClickHouseProfileEvents_ReadBufferFromS3Bytes)))
Cloud overviewNetwork receive bytes/secClickHouseProfileEvents_NetworkReceiveBytes
Cloud overviewNetwork send bytes/secClickHouseProfileEvents_NetworkSendBytes

Related links:
https://clickhouse.com/docs/en/integrations/prometheus

· One min read

Question

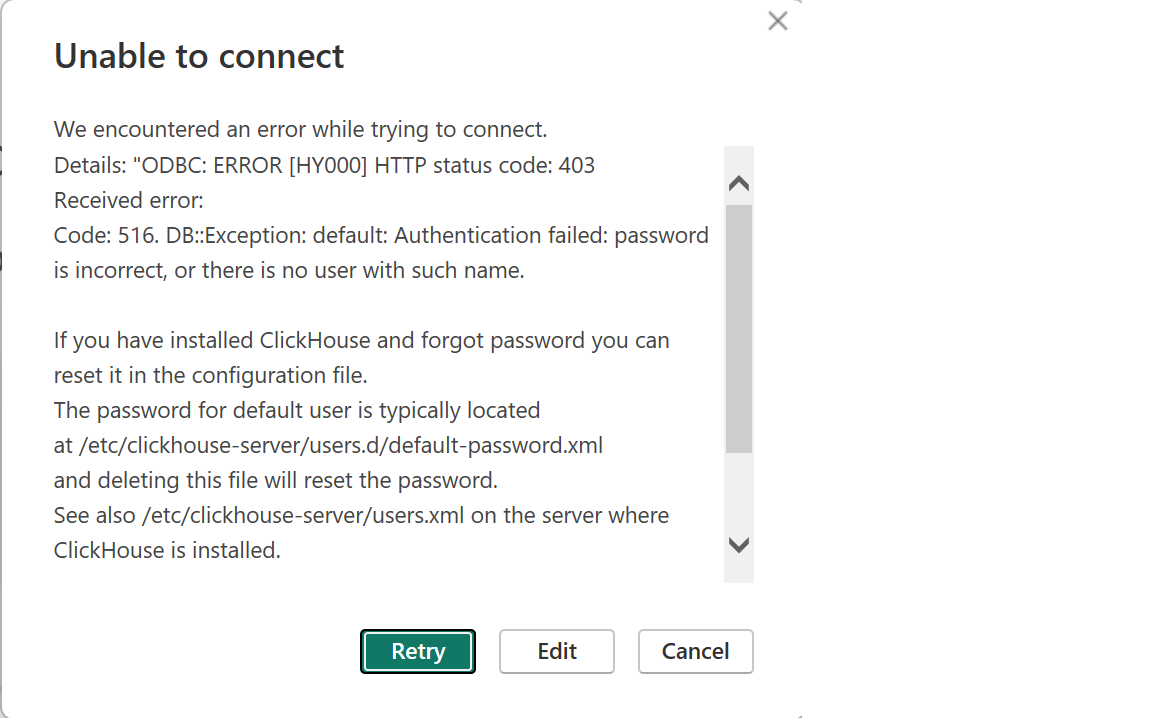
When trying to connect from PowerBI to ClickHouse using the connector, you receive the following authentication error:

We encountered an error while trying to connect.
Details: "ODBC: ERROR [HY000] HTTP status code: 403
Received error:
Code: 516. DB::Exception: default: Authentication failed: password is incorrect, or there is no user with such name.
If you have installed ClickHouse and forgot password you can reset it in the configuration file.
The password for default user is typically located at /etc/clickhouse-server/users.d/default-password.xml and deleting this file will reset the password.
See also /etc/clickhouse-server/users.ml on the server where
ClickHouse is installed.

powerbi_error

Answer

Check the password being used to see if the password contains a tilde ~.

The recommendation is to use a dedicated user for the connection and set the password manually. If using ClickHouse Cloud and the admin level of permissions with the default user is needed, then create a new user and and assign the default_role.

For more information:
https://clickhouse.com/docs/en/operations/access-rights#user-account-management
https://clickhouse.com/docs/en/cloud/security/cloud-access-management#database-roles